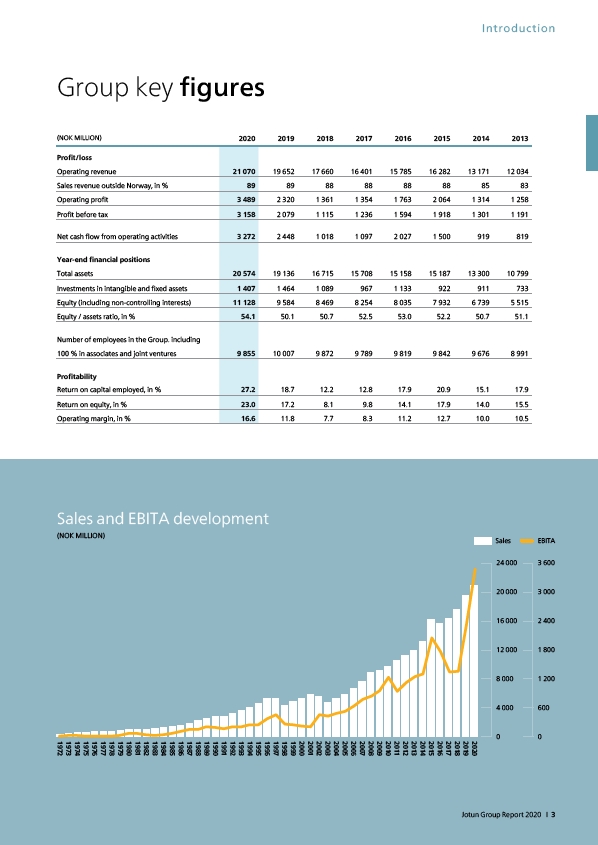
Sales and EBITA development
(NOK MILLION)
Introduction
Sales EBITA
24 000
20 000
16 000
12 000
8 000
4 000
0
2020
2019
2018
2017
2016
2015
2014
2013
2012
2011
2010
2009
2008
2007
2006
2005
2004
2003
2002
2001
2000
1999
1998
1997
1996
1995
1994
1993
1992
1991
1990
1989
1988
1987
1986
1985
1984
1983
1982
1981
1980
1979
1978
1977
1976
1975
1974
1973
1972
3 600
3 000
2 400
1 800
1 200
600
0
Group key figures
(NOK MILLION) 2020 2019 2018 2017 2016 2015 2014 2013
Profit/loss
Operating revenue 21 070 19 652 17 660 16 401 15 785 16 282 13 171 12 034
Sales revenue outside Norway, in % 89 89 88 88 88 88 85 83
Operating profit 3 489 2 320 1 361 1 354 1 763 2 064 1 314 1 258
Profit before tax 3 158 2 079 1 115 1 236 1 594 1 918 1 301 1 191
Net cash flow from operating activities 3 272 2 448 1 018 1 097 2 027 1 500 919 819
Year-end financial positions
Total assets 20 574 19 136 16 715 15 708 15 158 15 187 13 300 10 799
Investments in intangible and fixed assets 1 407 1 464 1 089 967 1 133 922 911 733
Equity (including non-controlling interests) 11 128 9 584 8 469 8 254 8 035 7 932 6 739 5 515
Equity / assets ratio, in % 54.1 50.1 50.7 52.5 53.0 52.2 50.7 51.1
Number of employees in the Group. including
100 % in associates and joint ventures 9 855 10 007 9 872 9 789 9 819 9 842 9 676 8 991
Profitability
Return on capital employed, in % 27.2 18.7 12.2 12.8 17.9 20.9 15.1 17.9
Return on equity, in % 23.0 17.2 8.1 9.8 14.1 17.9 14.0 15.5
Operating margin, in % 16.6 11.8 7.7 8.3 11.2 12.7 10.0 10.5
Jotun Group Report 2020 I 3