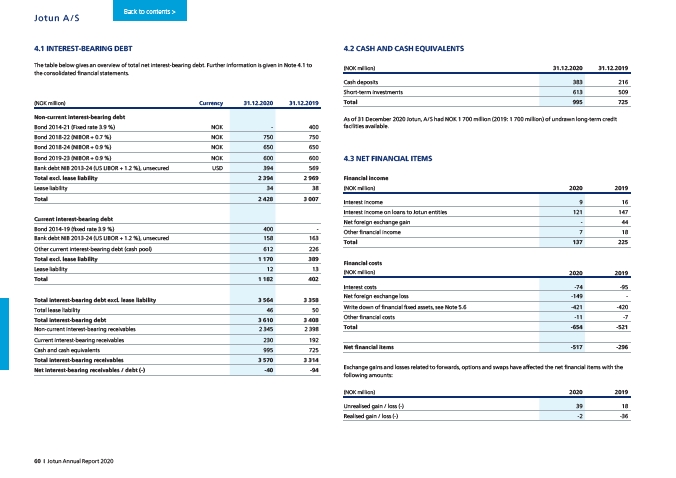
4.1 INTEREST-BEARING DEBT
The table below gives an overview of total net interest-bearing debt. Further information is given in Note 4.1 to
the consolidated financial statements.
(NOK million) Currency 31.12.2020 31.12.2019
Non-current interest-bearing debt
Bond 2014-21 (Fixed rate 3.9 %) NOK - 400
Bond 2018-22 (NIBOR + 0.7 %) NOK 750 750
Bond 2018-24 (NIBOR + 0.9 %) NOK 650 650
Bond 2019-23 (NIBOR + 0.9 %) NOK 600 600
Bank debt NIB 2013-24 (US LIBOR + 1.2 %), unsecured USD 394 569
Total excl. lease liability 2 394 2 969
Lease liability 34 38
Total 2 428 3 007
Current interest-bearing debt
Bond 2014-19 (fixed rate 3.9 %) 400 -
Bank debt NIB 2013-24 (US LIBOR + 1.2 %), unsecured 158 163
Other current interest-bearing debt (cash pool) 612 226
Total excl. lease liability 1 170 389
Lease liability 12 13
Total 1 182 402
Total interest-bearing debt excl. lease liability 3 564 3 358
Total lease liability 46 50
Total interest-bearing debt 3 610 3 408
Non-current interest-bearing receivables 2 345 2 398
Current interest-bearing receivables 230 192
Cash and cash equivalents 995 725
Total interest-bearing receivables 3 570 3 314
Net interest-bearing receivables / debt (-) -40 -94
4.2 CASH AND CASH EQUIVALENTS
(NOK million) 31.12.2020 31.12.2019
Cash deposits 383 216
Short-term investments 613 509
Total 995 725
As of 31 December 2020 Jotun, A/S had NOK 1 700 million (2019: 1 700 million) of undrawn long-term credit
facilities available.
4.3 NET FINANCIAL ITEMS
Financial income
(NOK million) 2020 2019
Interest income 9 16
Interest income on loans to Jotun entities 121 147
Net foreign exchange gain - 44
Other financial income 7 18
Total 137 225
Financial costs
(NOK million) 2020 2019
Interest costs -74 -95
Net foreign exchange loss -149 -
Write down of financial fixed assets, see Note 5.6 -421 -420
Other financial costs -11 -7
Total -654 -521
Net financial items -517 -296
Exchange gains and losses related to forwards, options and swaps have affected the net financial items with the
following amounts:
(NOK million) 2020 2019
Unrealised gain / loss (-) 39 18
Realised gain / loss (-) -2 -36
Back to contents >
Jotun A/S
60 I Jotun Annual Report 2020