4.2 CASH AND CASH EQUIVALENTS
(NOK million) 2020 2019
Cash deposits 2 343 1 394
Short-term investments 613 509
Total 2 956 1 903
Cash deposits in banks are attributable to the Group’s cash pool arrangement and local bank accounts held
by the respective subsidiaries. Only subsidiaries owned 100 per cent by the Group are participants in the cash
pool. The net cash position in the Group’s cash pool per 31 December 2020 was NOK 378 million (2019: NOK
190 million).
Surplus cash in subsidiaries not participating in the cash pool is accessible through dividend distribution and/or
repayment of debt to Jotun A/S. Increased cash and cash equivalents is due to improved financial performance.
Accounting policy
Cash includes cash in hand and cash deposits in banks. Cash equivalents are short-term liquid investments
which are convertible into a known amount of cash on short notice and have a maximum term to maturity of
three months.
4.3 NET FINANCIAL ITEMS
The Group has net financial items mainly comprising net interest expenses, foreign exchange gains and losses and
fair value changes of the Group’s financial instruments related to hedging.
Financial income
(NOK million) 2020 2019
Fair value changes financial instruments 32 18
Interest income 31 33
Dividend 3 3
Net foreign exchange gain 51 13
Other financial income 5 18
Total 123 86
Financial cost
(NOK million) 2020 2019
Interest costs -185 -236
Net foreign exchange loss -212 -43
Other financial costs -56 -48
Total -453 -327
Net financial items -331 -242
Exchange gains and losses related to forwards, options and swaps in Jotun A/S have affected the net financial-items
with the following amounts:
(NOK million) 2020 2019
Unrealised gain/loss (-) 32 18
Realised gain/loss (-) -24 -36
Unrealised part is reported as fair value changes financial instruments, while the realised part is reported as foreign
exchange gain or loss.
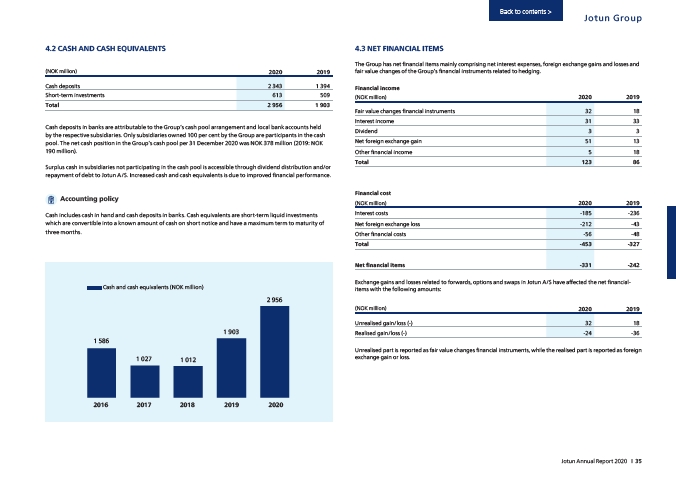
Cash and cash equivalents (NOK million)
1 586
1 027 1 012
1 903
2 956
2016 2017 2018 2019 2020
Back to contents >
Jotun Group
Jotun Annual Report 2020 I 35