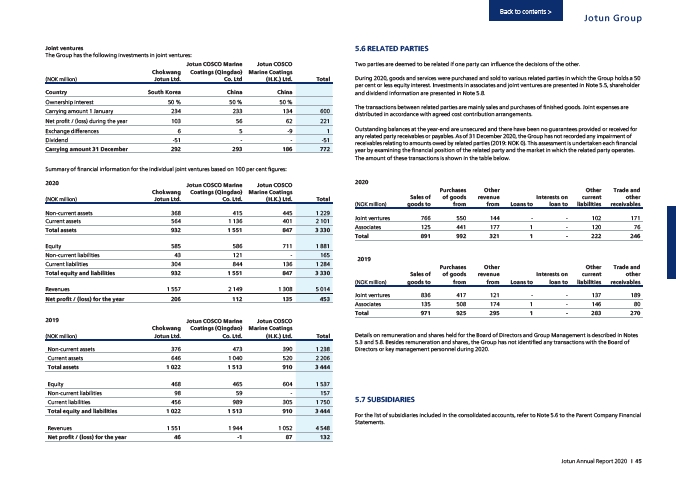
Joint ventures
The Group has the following investments in joint ventures:
(NOK million)
Chokwang
Jotun Ltd.
Jotun COSCO Marine
Coatings (Qingdao)
Co. Ltd
Jotun COSCO
Marine Coatings
(H.K.) Ltd. Total
Country South Korea China China
Ownership interest 50 % 50 % 50 %
Carrying amount 1 January 234 233 134 600
Net profit / (loss) during the year 103 56 62 221
Exchange differences 6 5 -9 1
Dividend -51 - - -51
Carrying amount 31 December 292 293 186 772
Summary of financial information for the individual joint ventures based on 100 per cent figures:
(NOK million)
Chokwang
Jotun Ltd.
Jotun COSCO Marine
Coatings (Qingdao)
Co. Ltd.
Jotun COSCO
Marine Coatings
(H.K.) Ltd. Total
Non-current assets 368 415 445 1 229
Current assets 564 1 136 401 2 101
Total assets 932 1 551 847 3 330
Equity 585 586 711 1 881
Non-current liabilities 43 121 - 165
Current liabilities 304 844 136 1 284
Total equity and liabilities 932 1 551 847 3 330
Revenues 1 557 2 149 1 308 5 014
Net profit / (loss) for the year 206 112 135 453
(NOK million)
Chokwang
Jotun Ltd.
Jotun COSCO Marine
Coatings (Qingdao)
Co. Ltd.
Jotun COSCO
Marine Coatings
(H.K.) Ltd. Total
Non-current assets 376 473 390 1 238
Current assets 646 1 040 520 2 206
Total assets 1 022 1 513 910 3 444
Equity 468 465 604 1 537
Non-current liabilities 98 59 - 157
Current liabilities 456 989 305 1 750
Total equity and liabilities 1 022 1 513 910 3 444
Revenues 1 551 1 944 1 052 4 548
Net profit / (loss) for the year 46 -1 87 132
5.6 RELATED PARTIES
Two parties are deemed to be related if one party can influence the decisions of the other.
During 2020, goods and services were purchased and sold to various related parties in which the Group holds a 50
per cent or less equity interest. Investments in associates and joint ventures are presented in Note 5.5, shareholder
and dividend information are presented in Note 5.8.
The transactions between related parties are mainly sales and purchases of finished goods. Joint expenses are
distributed in accordance with agreed cost contribution arrangements.
Outstanding balances at the year-end are unsecured and there have been no guarantees provided or received for
any related party receivables or payables. As of 31 December 2020, the Group has not recorded any impairment of
receivables relating to amounts owed by related parties (2019: NOK 0). This assessment is undertaken each financial
year by examining the financial position of the related party and the market in which the related party operates.
The amount of these transactions is shown in the table below.
2020
(NOK million)
Sales of
goods to
Purchases
of goods
from
Other
revenue
from Loans to
Interests on
loan to
Other
current
liabilities
Trade and
other
receivables
Joint ventures 766 550 144 - - 102 171
Associates 125 441 177 1 - 120 76
Total 891 992 321 1 - 222 246
2019
(NOK million)
Sales of
goods to
Purchases
of goods
from
Other
revenue
from Loans to
Interests on
loan to
Other
current
liabilities
Trade and
other
receivables
Joint ventures 836 417 121 - - 137 189
Associates 135 508 174 1 - 146 80
Total 971 925 295 1 - 283 270
Details on remuneration and shares held for the Board of Directors and Group Management is described in Notes
5.3 and 5.8. Besides remuneration and shares, the Group has not identified any transactions with the Board of
Directors or key management personnel during 2020.
5.7 SUBSIDIARIES
For the list of subsidiaries included in the consolidated accounts, refer to Note 5.6 to the Parent Company Financial
Statements.
2020
2019
Back to contents >
Jotun Group
Jotun Annual Report 2020 I 45