(NOK million) Note 31.12.2020 31.12.2019 Change
Inventories 3.5 2 877 2 830 48
Accounts receivable 3.6 4 432 4 694 -262
Trade payables 5.9 -2 334 -2 114 -220
Operating working capital 4 975 5 409 -434
Bank drafts 3.6 134 149 -15
Other receivables 3.6 413 422 -9
Public charges and holiday pay 3.7 -344 -289 -56
Other accrued expenses 3.7 -902 -1 054 152
Current provisions 3.7, 3.8 -146 -370 223
Other working capital -846 -1 141 295
Net working capital 4 129 4 268 -139
Intangible assets 3.2 741 712 29
Property, plant and equipment 3.3 6 985 6 489 496
Investments in associates and joint ventures 3.4 1 598 1 486 112
Non-current provisions 3.8 -314 -274 -40
Pension liabilities 5.2 -243 -221 -23
Other non-current liabilities -50 -46 -4
Invested capital 8 717 8 147 569
Capital employed 12 846 12 416 430
Net deferred tax 5.1 296 323 -26
Tax payable 5.1 -259 -266 7
Share investments 5.9 16 16 -
Prepaid dividend from associates and joint ventures 3.7 -257 -323 66
Other invested capital -204 -250 46
Invested capital and working capital items 12 642 12 166 476
Net interest-bearing debt 4.1 -1 514 -2 581 1 067
Total equity 11 128 9 584 1 544
Jotun Group
3.1 OVERVIEW
Back to contents >
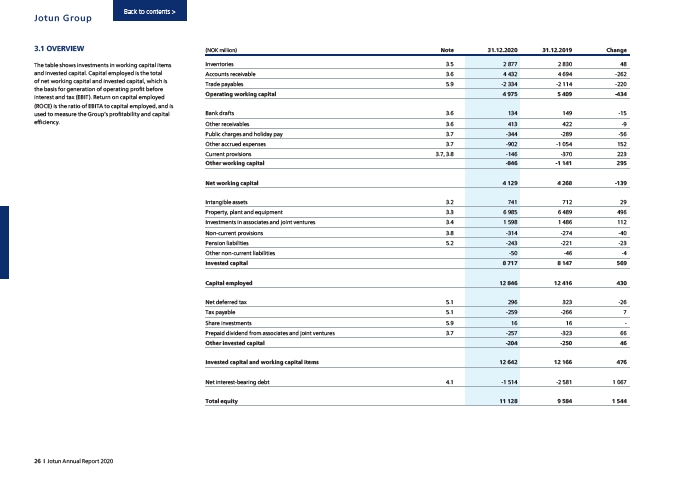
The table shows investments in working capital items
and invested capital. Capital employed is the total
of net working capital and invested capital, which is
the basis for generation of operating profit before
interest and tax (EBIT). Return on capital employed
(ROCE) is the ratio of EBITA to capital employed, and is
used to measure the Group’s profitability and capital
efficiency.
26 I Jotun Annual Report 2020