Back to contents >
Jotun Group
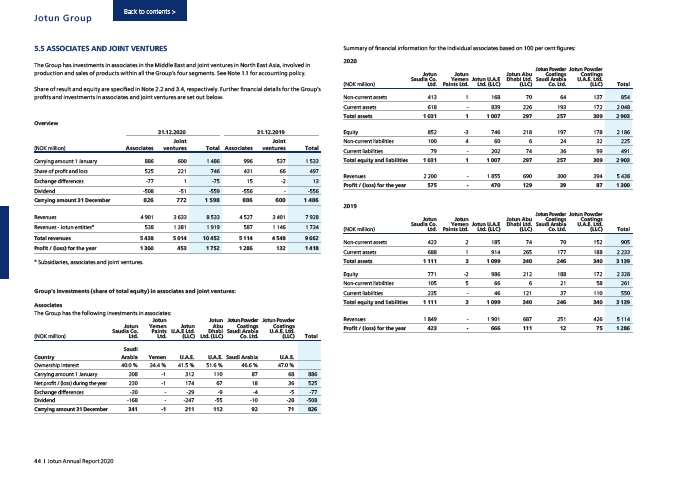
5.5 ASSOCIATES AND JOINT VENTURES
The Group has investments in associates in the Middle East and joint ventures in North East Asia, involved in
production and sales of products within all the Group’s four segments. See Note 1.1 for accounting policy.
Share of result and equity are specified in Note 2.2 and 3.4, respectively. Further financial details for the Group’s
profits and investments in associates and joint ventures are set out below.
Group’s investments (share of total equity) in associates and joint ventures:
Associates
The Group has the following investments in associates:
(NOK million)
Jotun
Saudia Co.
Ltd.
Jotun
Yemen
Paints
Ltd.
Jotun
U.A.E Ltd.
(LLC)
Jotun
Abu
Dhabi
Ltd. (LLC)
Jotun Powder
Coatings
Saudi Arabia
Co. Ltd.
Jotun Powder
Coatings
U.A.E. Ltd.
(LLC) Total
Country
Saudi
Arabia Yemen U.A.E. U.A.E. Saudi Arabia U.A.E.
Ownership interest 40.0 % 34.4 % 41.5 % 51.6 % 46.6 % 47.0 %
Carrying amount 1 January 308 -1 312 110 87 68 886
Net profit / (loss) during the year 230 -1 174 67 18 36 525
Exchange differences -30 - -29 -9 -4 -5 -77
Dividend -168 - -247 -55 -10 -28 -508
Carrying amount 31 December 341 -1 211 112 92 71 826
Summary of financial information for the individual associates based on 100 per cent figures:
2020
(NOK million)
Jotun
Saudia Co.
Ltd.
Jotun
Yemen
Paints Ltd.
Jotun U.A.E
Ltd. (LLC)
Jotun Abu
Dhabi Ltd.
(LLC)
Jotun Powder
Coatings
Saudi Arabia
Co. Ltd.
Jotun Powder
Coatings
U.A.E. Ltd.
(LLC) Total
Non-current assets 413 1 168 70 64 137 854
Current assets 618 - 839 226 193 172 2 048
Total assets 1 031 1 1 007 297 257 309 2 903
Equity 852 -3 746 218 197 178 2 186
Non-current liabilities 100 4 60 6 24 32 225
Current liabilities 79 - 202 74 36 99 491
Total equity and liabilities 1 031 1 1 007 297 257 309 2 903
Revenues 2 200 - 1 855 690 300 394 5 438
Profit / (loss) for the year 575 - 470 129 39 87 1 300
2019
(NOK million)
Jotun
Saudia Co.
Ltd.
Jotun
Yemen
Paints Ltd.
Jotun U.A.E
Ltd. (LLC)
Jotun Abu
Dhabi Ltd.
(LLC)
Jotun Powder
Coatings
Saudi Arabia
Co. Ltd.
Jotun Powder
Coatings
U.A.E. Ltd.
(LLC) Total
Non-current assets 423 2 185 74 70 152 905
Current assets 688 1 914 265 177 188 2 233
Total assets 1 111 3 1 099 340 246 340 3 139
Equity 771 -2 986 212 188 172 2 328
Non-current liabilities 105 5 66 6 21 58 261
Current liabilities 235 - 46 121 37 110 550
Total equity and liabilities 1 111 3 1 099 340 246 340 3 139
Revenues 1 849 - 1 901 687 251 426 5 114
Profit / (loss) for the year 423 - 666 111 12 75 1 286
Overview
31.12.2020 31.12.2019
(NOK million) Associates
Joint
ventures Total Associates
Joint
ventures Total
Carrying amount 1 January 886 600 1 486 996 537 1 533
Share of profit and loss 525 221 746 431 66 497
Exchange differences -77 1 -75 15 -2 13
Dividend -508 -51 -559 -556 - -556
Carrying amount 31 December 826 772 1 598 886 600 1 486
Revenues 4 901 3 633 8 533 4 527 3 401 7 928
Revenues - Jotun entities* 538 1 381 1 919 587 1 146 1 734
Total revenues 5 438 5 014 10 452 5 114 4 548 9 662
Profit / (loss) for the year 1 300 453 1 752 1 286 132 1 418
* Subsidiaries, associates and joint ventures.
44 I Jotun Annual Report 2020