4.1 INTEREST-BEARING DEBT
The Group’s main sources of financing are from the Norwegian Bond market and bilateral bank facilities.
Certificate loans are also used as a source of liquidity. The time to maturity for new loans and credit facilities is
normally 3-5 years.
Bond funding in the Group has remained unchanged during 2020. The loan from Nordic Investment Bank (NIB)
of USD 120 million is maintained and semi-annual instalments began in 2018.
As of 31 December 2020, there were no drawings on the committed credit facilities.
(NOK million) Currency 31.12.2020 31.12.2019
Non-current interest-bearing debt
Bond 2014-21 (Fixed rate 3.9 %) NOK - 400
Bond 2018-22 (NIBOR+0.7 %) NOK 750 750
Bond 2018-24 (NIBOR+0.9 %) NOK 650 650
Bond 2019-23 (NIBOR+0.93 %) NOK 600 600
Bank debt NIB 2013-24 (USD LIBOR+1.2 %), unsecured USD 394 569
Other Bank debt, unsecured 286 58
Total excl. lease liability 2 680 3 027
Lease liability 327 334
Total 3 007 3 361
Current interest-bearing debt
Bond 2014-21 (Fixed rate 3.9 %) 400 -
Bank debt NIB 2013-24 (USD LIBOR+1.2 %), unsecured 158 163
Other bank debt, unsecured 810 894
Other bank debt, secured 44 29
Total excl. lease liability 1 412 1 085
Lease liability, ref. Note 5.4 116 111
Total 1 528 1 197
Total interest-bearing debt excl. lease liability 4 092 4 112
Total lease liability, ref. Note 5.4 443 445
Total interest-bearing debt 4 534 4 558
Non-current interest-bearing receivables 65 73
Cash and cash equivalents 2 956 1 903
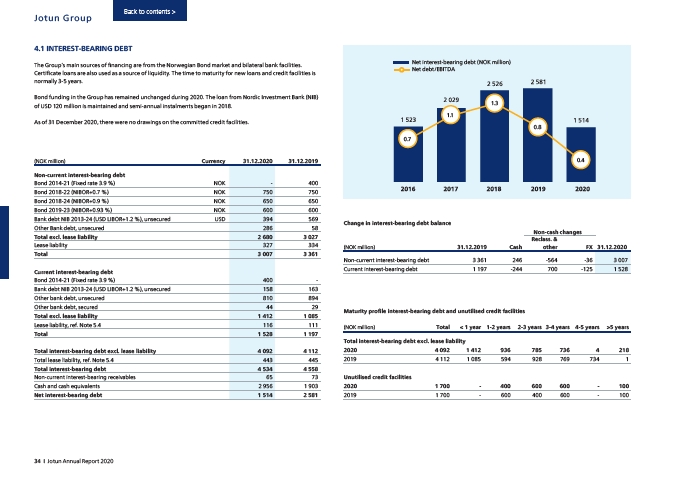
Net interest-bearing debt 1 514 2 581
Net interest-bearing debt (NOK million)
Net debt/EBITDA
0.7
1.1
Change in interest-bearing debt balance
1.3
(NOK million) 31.12.2019 Cash
0.8
0.4
Non-current interest-bearing debt 3 361 246 -564 -36 3 007
Current interest-bearing debt 1 197 -244 700 -125 1 528
Maturity profile interest-bearing debt and unutilised credit facilities
Non-cash changes
Reclass. &
other FX 31.12.2020
(NOK million) Total < 1 year 1-2 years 2-3 years 3-4 years 4-5 years >5 years
Total interest-bearing debt excl. lease liability
2020 4 092 1 412 936 785 736 4 218
2019 4 112 1 085 594 928 769 734 1
Unutilised credit facilities
2020 1 700 - 400 600 600 - 100
2019 1 700 - 600 400 600 - 100
Back to contents >
Jotun Group
34 I Jotun Annual Report 2020