Section 04
This section includes notes related to
Jotun’s capital structure and financial
items, including financial risks.
Capital Structure and
Financial Items
Jotun Group
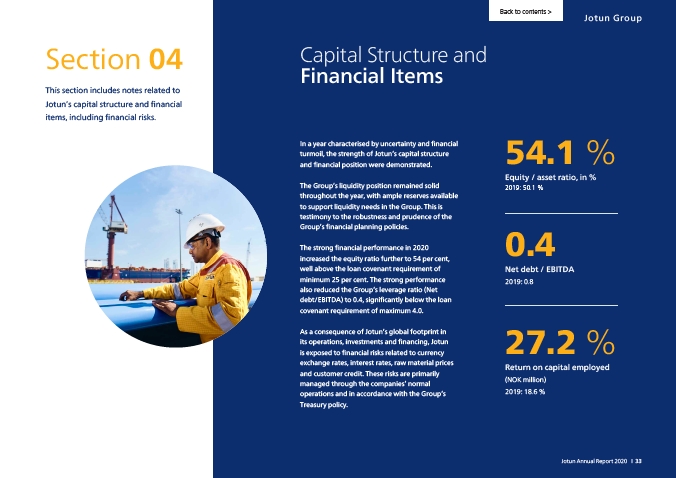
54.1 %
Equity / asset ratio, in %
2019: 50.1 %
0.4
Net debt / EBITDA
2019: 0.8
27.2 %
Return on capital employed
(NOK million)
2019: 18.6 %
In a year characterised by uncertainty and financial
turmoil, the strength of Jotun’s capital structure
and financial position were demonstrated.
The Group’s liquidity position remained solid
throughout the year, with ample reserves available
to support liquidity needs in the Group. This is
testimony to the robustness and prudence of the
Group’s financial planning policies.
The strong financial performance in 2020
increased the equity ratio further to 54 per cent,
well above the loan covenant requirement of
minimum 25 per cent. The strong performance
also reduced the Group’s leverage ratio (Net
debt/EBITDA) to 0.4, significantly below the loan
covenant requirement of maximum 4.0.
As a consequence of Jotun’s global footprint in
its operations, investments and financing, Jotun
is exposed to financial risks related to currency
exchange rates, interest rates, raw material prices
and customer credit. These risks are primarily
managed through the companies’ normal
operations and in accordance with the Group’s
Treasury policy.
Back to contents >
Jotun Annual Report 2020 I 33