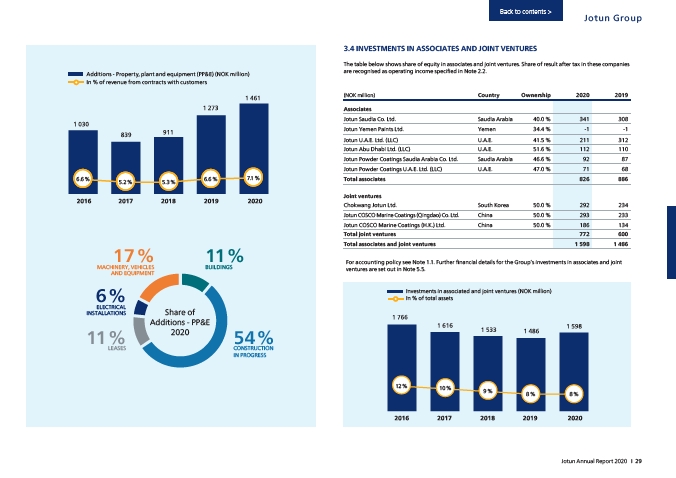
Additions - Property, plant and equipment (PP&E) (NOK million)
In % of revenue from contracts with customers
6.6 % 5.2 % 5.3 % 6.6 % 7.1 %
3.4 INVESTMENTS IN ASSOCIATES AND JOINT VENTURES
The table below shows share of equity in associates and joint ventures. Share of result after tax in these companies
are recognised as operating income specified in Note 2.2.
(NOK million) Country Ownership 2020 2019
Associates
Jotun Saudia Co. Ltd. Saudia Arabia 40.0 % 341 308
Jotun Yemen Paints Ltd. Yemen 34.4 % -1 -1
Jotun U.A.E. Ltd. (LLC) U.A.E. 41.5 % 211 312
Jotun Abu Dhabi Ltd. (LLC) U.A.E. 51.6 % 112 110
Jotun Powder Coatings Saudia Arabia Co. Ltd. Saudia Arabia 46.6 % 92 87
Jotun Powder Coatings U.A.E. Ltd. (LLC) U.A.E. 47.0 % 71 68
Total associates 826 886
Joint ventures
Chokwang Jotun Ltd. South Korea 50.0 % 292 234
Jotun COSCO Marine Coatings (Qingdao) Co. Ltd. China 50.0 % 293 233
Jotun COSCO Marine Coatings (H.K.) Ltd. China 50.0 % 186 134
Total joint ventures 772 600
Total associates and joint ventures 1 598 1 486
For accounting policy see Note 1.1. Further financial details for the Group’s investments in associates and joint
ventures are set out in Note 5.5.
Investments in associated and joint ventures (NOK million)
In % of total assets
12 % 10 % 9 %
8 % 8 %
Share of
17 %
MACHINERY, VEHICLES
AND EQUIPMENT
Additions - PP&E
2020
11 %
BUILDINGS
54 %
CONSTRUCTION
IN PROGRESS
6 %
ELECTRICAL
INSTALLATIONS
11 %
LEASES
Back to contents >
Jotun Group
Jotun Annual Report 2020 I 29