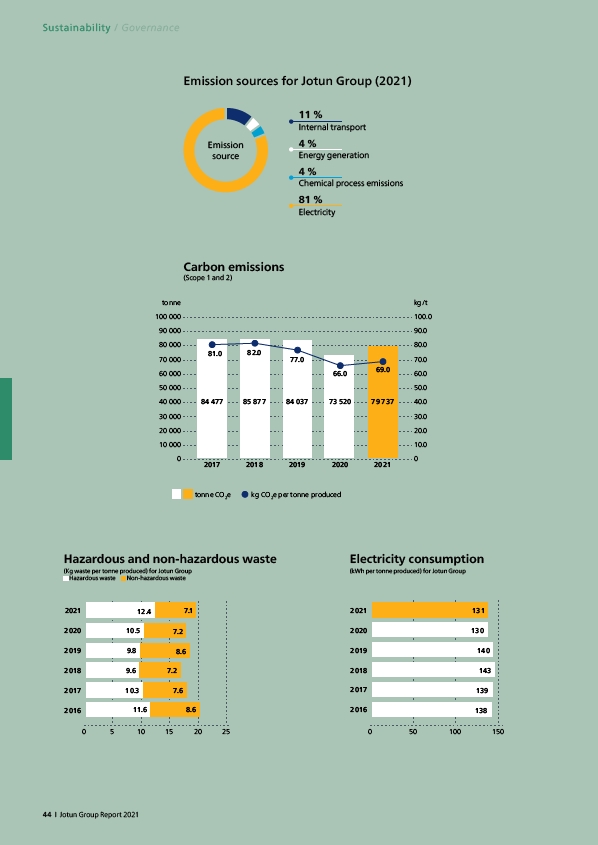
Emission sources for Jotun Group (2021)
11 %
Internal transport
kg/t
100.0
90.0
80.0
70.0
60.0
50.0
40.0
30.0
20.0
69.0
Electricity consumption
(kWh per tonne produced) for Jotun Group
2021 131
130
140
0 50 100 150
2020
2019
2018
2017
2016
143
139
138
tonne
100 000
90 000
80 000
70 000
60 000
50 000
40 000
30 000
20 000
10 000
81.0
82.0
Hazardous and non-hazardous waste
(Kg waste per tonne produced) for Jotun Group
Hazardous waste Non-hazardous waste
2021 12.4 7.1
10.5 7.2
0 5 10 15 20 25
2020
2019
2018
2017
2016
8.6
7.2
7.6
8.6
9.8
9.6
10.3
11.6
Carbon emissions
(Scope 1 and 2)
4 %
Energy generation
4 %
Chemical process emissions
81 %
Electricity
Emission
source
0
0
tonne CO2e
10.0
84 477
2017
85 877
2018
77.0
84 037
2019
66.0
73 520
2020
79 737
2021
kg CO2e per tonne produced
Sustainability / Governance
44 I Jotun Group Report 2021