5.9 DETAILS OF FINANCIAL ASSETS AND LIABILITIES
This note gives an overview of measurement of financial assets and liabilities and the accounting treatment
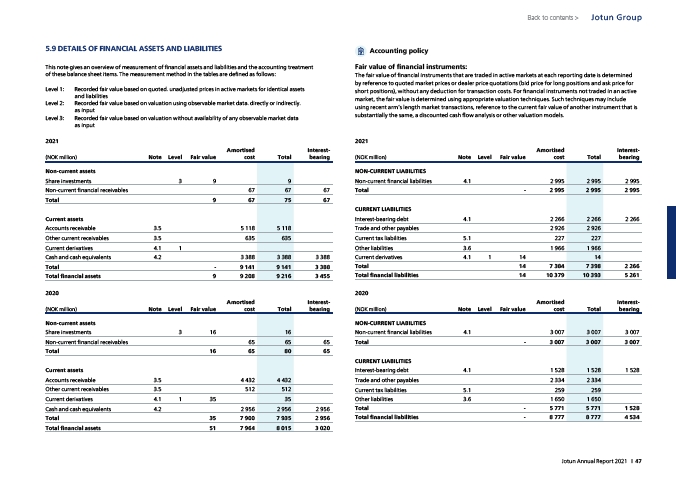
of these balance sheet items. The measurement method in the tables are defined as follows:
Level 1: Recorded fair value based on quoted. unadjusted prices in active markets for identical assets
and liabilities
Level 2: Recorded fair value based on valuation using observable market data. directly or indirectly.
as input
Level 3: Recorded fair value based on valuation without availability of any observable market data
as input
2021
(NOK million) Note Level Fair value
Amortised
cost Total
Interest-
bearing
Non-current assets
Share investments 3 9 9
Non-current financial receivables 67 67 67
Total 9 67 75 67
Current assets
Accounts receivable 3.5 5 118 5 118
Other current receivables 3.5 635 635
Current derivatives 4.1 1
Cash and cash equivalents 4.2 3 388 3 388 3 388
Total - 9 141 9 141 3 388
Total financial assets 9 9 208 9 216 3 455
2020
(NOK million) Note Level Fair value
Amortised
cost Total
Interest-
bearing
Non-current assets
Share investments 3 16 16
Non-current financial receivables 65 65 65
Total 16 65 80 65
Current assets
Accounts receivable 3.5 4 432 4 432
Other current receivables 3.5 512 512
Current derivatives 4.1 1 35 35
Cash and cash equivalents 4.2 2 956 2 956 2 956
Total 35 7 900 7 935 2 956
Total financial assets 51 7 964 8 015 3 020
Accounting policy
Jotun Group
Back to contents >
Fair value of financial instruments:
The fair value of financial instruments that are traded in active markets at each reporting date is determined
by reference to quoted market prices or dealer price quotations (bid price for long positions and ask price for
short positions), without any deduction for transaction costs. For financial instruments not traded in an active
market, the fair value is determined using appropriate valuation techniques. Such techniques may include
using recent arm’s length market transactions, reference to the current fair value of another instrument that is
substantially the same, a discounted cash flow analysis or other valuation models.
2021
(NOK million) Note Level Fair value
Amortised
cost Total
Interest-
bearing
NON-CURRENT LIABILITIES
Non-current financial liabilities 4.1 2 995 2 995 2 995
Total - 2 995 2 995 2 995
CURRENT LIABILITIES
Interest-bearing debt 4.1 2 266 2 266 2 266
Trade and other payables 2 926 2 926
Current tax liabilities 5.1 227 227
Other liabilities 3.6 1 966 1 966
Current derivatives 4.1 1 14 14
Total 14 7 384 7 398 2 266
Total financial liabilities 14 10 379 10 393 5 261
2020
(NOK million) Note Level Fair value
Amortised
cost Total
Interest-
bearing
NON-CURRENT LIABILITIES
Non-current financial liabilities 4.1 3 007 3 007 3 007
Total - 3 007 3 007 3 007
CURRENT LIABILITIES
Interest-bearing debt 4.1 1 528 1 528 1 528
Trade and other payables 2 334 2 334
Current tax liabilities 5.1 259 259
Other liabilities 3.6 1 650 1 650
Total - 5 771 5 771 1 528
Total financial liabilities - 8 777 8 777 4 534
Jotun Annual Report 2021 I 47