(NOK million) Note 31.12.2021 31.12.2020 Change
Inventories 3.4 4 034 2 877 1 156
Accounts receivable 3.5 5 118 4 432 686
Trade payables 5.9 -2 926 -2 334 -591
Operating working capital 6 227 4 975 1 251
Bank drafts 3.5 118 134 -16
Other receivables 3.5 516 413 104
Public charges and holiday pay 3.6 -332 -344 12
Other accrued expenses 3.6 -1 139 -902 -236
Current provisions 3.6, 3.7 -206 -146 -59
Other working capital -1 042 -846 -196
Net working capital 5 185 4 129 1 055
Intangible assets 3.2 765 741 24
Property, plant and equipment 3.3 7 612 6 985 628
Investments in associates and joint ventures 5.5 1 419 1 598 -179
Non-current provisions 3.7 -188 -314 125
Pension liabilities 5.2 -296 -243 -52
Other non-current liabilities -15 -50 35
Invested capital 9 298 8 717 581
Capital employed 14 482 12 846 1 637
Net deferred tax 5.1 313 296 17
Tax payable 5.1 -227 -259 33
Share investments 5.9 9 16 -7
Prepaid dividend from associates and joint ventures 3.6 -301 -257 -44
Other invested capital -206 -204 -2
Invested capital and working capital items 14 276 12 642 1 634
Net interest-bearing debt 4.1 -1 807 -1 514 -293
Total Equity 12 468 11 128 1 340
Jotun Group
3.1 OVERVIEW
Back to contents >
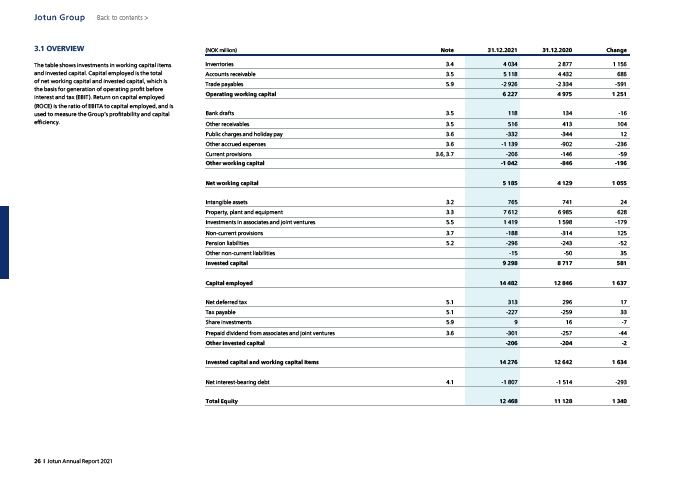
The table shows investments in working capital items
and invested capital. Capital employed is the total
of net working capital and invested capital, which is
the basis for generation of operating profit before
interest and tax (EBIT). Return on capital employed
(ROCE) is the ratio of EBITA to capital employed, and is
used to measure the Group’s profitability and capital
efficiency.
26 I Jotun Annual Report 2021