Back to contents >
Group key
figures
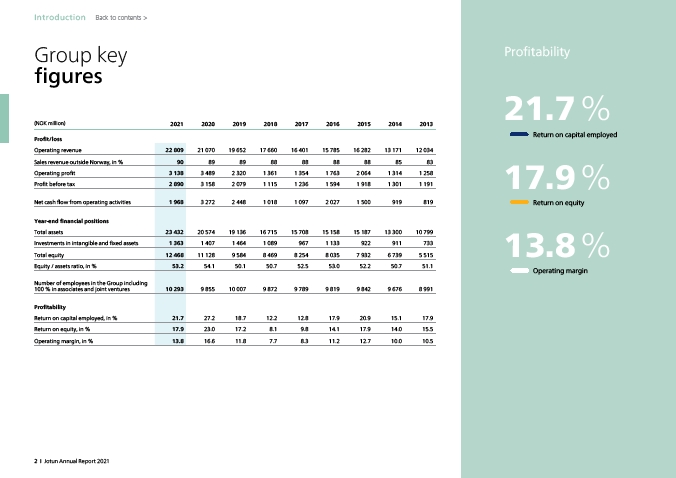
(NOK million) 2021 2020 2019 2018 2017 2016 2015 2014 2013
Profit/loss
Operating revenue 22 809 21 070 19 652 17 660 16 401 15 785 16 282 13 171 12 034
Sales revenue outside Norway, in % 90 89 89 88 88 88 88 85 83
Operating profit 3 138 3 489 2 320 1 361 1 354 1 763 2 064 1 314 1 258
Profit before tax 2 890 3 158 2 079 1 115 1 236 1 594 1 918 1 301 1 191
Net cash flow from operating activities 1 968 3 272 2 448 1 018 1 097 2 027 1 500 919 819
Year-end financial positions
Total assets 23 432 20 574 19 136 16 715 15 708 15 158 15 187 13 300 10 799
Investments in intangible and fixed assets 1 363 1 407 1 464 1 089 967 1 133 922 911 733
Total equity 12 468 11 128 9 584 8 469 8 254 8 035 7 932 6 739 5 515
Equity / assets ratio, in % 53.2 54.1 50.1 50.7 52.5 53.0 52.2 50.7 51.1
Number of employees in the Group including
100 % in associates and joint ventures 10 293 9 855 10 007 9 872 9 789 9 819 9 842 9 676 8 991
Profitability
Return on capital employed, in % 21.7 27.2 18.7 12.2 12.8 17.9 20.9 15.1 17.9
Return on equity, in % 17.9 23.0 17.2 8.1 9.8 14.1 17.9 14.0 15.5
Operating margin, in % 13.8 16.6 11.8 7.7 8.3 11.2 12.7 10.0 10.5
Profitability
21.7 %
Return on capital employed
17.9 %
Return on equity
13.8 %
Operating margin
Introduction
2 I Jotun Annual Report 2021