4.2 CASH AND CASH EQUIVALENTS
(NOK million) 31.12.2021 31.12.2020
Cash deposits 2 621 2 343
Short-term investments 767 613
Total 3 388 2 956
Cash deposits in banks are attributable to the Group’s cash pool arrangement and local bank accounts held
by the respective subsidiaries. Only subsidiaries owned 100 per cent by the Group are participants in the cash
pool. The net cash position in the Group’s cash pool per 31 December 2021 was NOK 372 million (2020: NOK
378 million).
Surplus cash in subsidiaries not participating in the cash pool is accessible through dividend distribution and/or
repayment of debt to Jotun A/S.
Accounting policy
Cash includes cash in hand and cash deposits in banks. Cash equivalents are short-term liquid investments
which are convertible into a known amount of cash on short notice and have a maximum term to maturity of
three months.
Back to contents >
4.3 NET FINANCIAL ITEMS
The Group has net financial items mainly comprising net interest expenses, foreign exchange gains and losses and
fair value changes of the Group’s financial instruments related to hedging.
Financial income
(NOK million) 2021 2020
Fair value changes financial instruments - 32
Interest income 21 31
Dividend 3 3
Net foreign exchange gain 43 51
Other financial income 6 5
Total 74 123
Financial cost
(NOK million) 2021 2020
Fair value changes financial instruments -34 -
Interest costs -168 -185
Net foreign exchange loss -67 -212
Other financial costs -53 -56
Total -322 -453
Net financial items -248 -331
Foreign exchange gains and losses related to forwards, options and swaps in Jotun A/S have affected net financial
items with the following amounts:
(NOK million) 2021 2020
Unrealised gain/loss (-) -34 32
Realised gain/loss (-) 20 -24
Unrealised part is reported as fair value changes financial instruments, while the realised part is reported as foreign
exchange gain or loss.
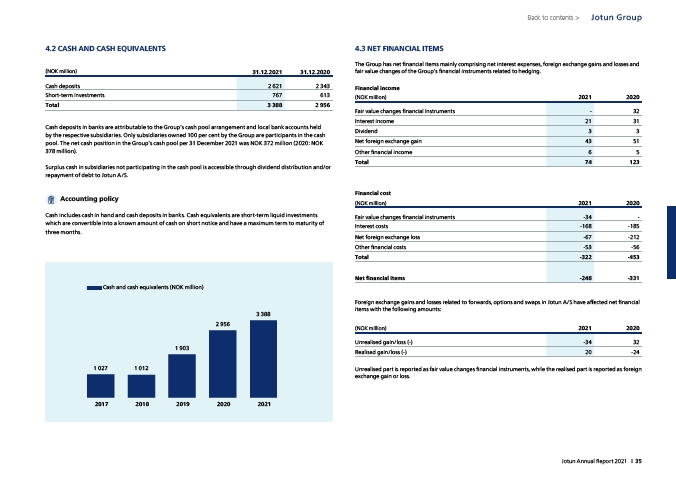
Cash and cash equivalents (NOK million)
1 027 1 012
2017
1 903
2 956
3 388
2018 2019 2020 2021
Jotun Group
Jotun Annual Report 2021 I 35