3.5 TRADE AND OTHER RECEIVABLES
Trade and other receivables are presented net of allowance for bad debt. Changes in allowance for bad debt,
including realised losses, are classified as other operating expenses in the income statement, ref. Note 2.3. Bank
drafts are received as payment of accounts receivable and have a maturity period of more than three months. Received
bank drafts are used to pay suppliers, ref. Note 3.9.
(NOK million) 31.12.2021 31.12.2020
Accounts receivable 5 118 4 432
Bank drafts 118 134
Trade receivables 5 237 4 566
Other receivables 516 413
Total 5 753 4 979
The change in allowance for bad debt is shown in the following table:
(NOK million) 31.12.2021 31.12.2020
Balance as of 1 January 264 189
Allowances for bad debt made during the period 27 99
Realised losses for the year -27 -24
Balance as of 31 December 264 264
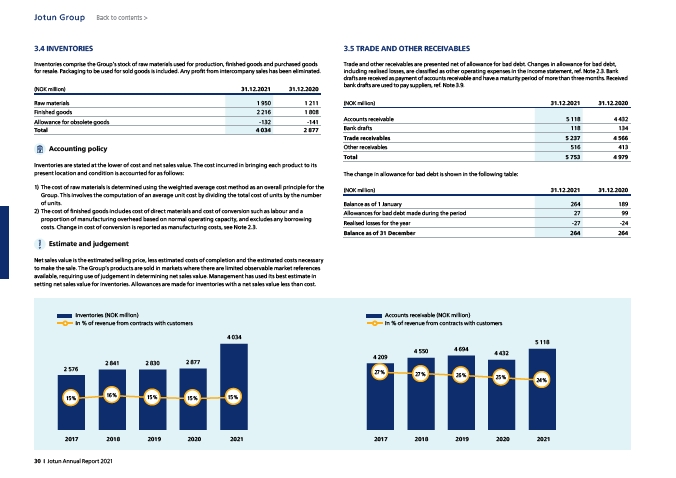
Accounts receivable (NOK million)
In % of revenue from contracts with customers
3.4 INVENTORIES
Back to contents >
Inventories comprise the Group’s stock of raw materials used for production, finished goods and purchased goods
for resale. Packaging to be used for sold goods is included. Any profit from intercompany sales has been eliminated.
(NOK million) 31.12.2021 31.12.2020
Raw materials 1 950 1 211
Finished goods 2 216 1 808
Allowance for obsolete goods -132 -141
Total 4 034 2 877
Accounting policy
Inventories are stated at the lower of cost and net sales value. The cost incurred in bringing each product to its
present location and condition is accounted for as follows:
1) The cost of raw materials is determined using the weighted average cost method as an overall principle for the
Group. This involves the computation of an average unit cost by dividing the total cost of units by the number
of units.
2) The cost of finished goods includes cost of direct materials and cost of conversion such as labour and a
proportion of manufacturing overhead based on normal operating capacity, and excludes any borrowing
costs. Change in cost of conversion is reported as manufacturing costs, see Note 2.3.
Estimate and judgement
Net sales value is the estimated selling price, less estimated costs of completion and the estimated costs necessary
to make the sale. The Group’s products are sold in markets where there are limited observable market references
available, requiring use of judgement in determining net sales value. Management has used its best estimate in
setting net sales value for inventories. Allowances are made for inventories with a net sales value less than cost.
Inventories (NOK million)
In % of revenue from contracts with customers
2 576
4 209
15 % 16 % 15 % 15 % 15 %
27 % 27 % 26 % 25 % 24 %
2017 2017
4 550 4 694
4 432
5 118
2 841 2 830 2 877
4 034
2018 2019 2020 2021 2018 2019 2020 2021
Jotun Group
30 I Jotun Annual Report 2021