Back to contents >
CONSOLIDATED STATEMENT OF CHANGES IN EQUITY
EQUITY HOLDERS OF THE PARENT COMPANY
(NOK million) Note
Share
capital
Other
equity
Translation
differences Total
Non-
controlling
interests
Total
equity
Equity as of 1 January 2020 103 8 310 892 9 305 280 9 584
Dividends 5.8 -547 -547 -79 -626
Profit for the year 2 280 2 280 98 2 378
Other comprehensive income -54 -182 -236 6 -230
Share capital increase - - - 22 22
Equity as of 31 December 2020 103 9 989 710 10 802 326 11 128
Dividends 5.8 -599 -599 -93 -691
Profit for the year 1 998 1 998 113 2 111
Other comprehensive income 7 -92 -85 2 -83
Share capital increase - - - 4 4
Equity as of 31 December 2021 103 11 396 618 12 116 352 12 468
CONSOLIDATED STATEMENT OF CASH FLOWS
(NOK million) Note 2021 2020
Cash flow from operating activities
Operating profit 3 138 3 489
Adjustments to reconcile operating profit to net cash flows:
Share of profit from associates and joint ventures 2.2, 5.5 -496 -746
Dividend paid from associates and joint ventures 5.5 727 559
Depreciation, amortisation and impairment 3.2, 3.3 876 824
Change in accruals, provisions and other 152 -290
Working capital adjustments:
Change in trade and other receivables -774 287
Change in trade payables 591 220
Change in inventories -1 156 -48
Cash generated from operating activities 3 059 4 294
Interest received 4.3 21 31
Interest paid 4.3 -168 -185
Other financial items -128 -117
Income tax payments -816 -752
Net cash flow from operating activities 1 968 3 272
Cash flows used for investing activities
Proceeds from sale of property, plant and equipment 80 18
Purchase of property, plant and equipment 3.3 -1 260 -1 296
Purchase of intangible assets 3.2 -103 -111
Share capital increase in non-controlling interests 4 22
Net cash flow used for investing activities -1 280 -1 367
Cash flows from financing activities
Proceeds from borrowings 2 284 1 020
Repayment of borrowings -1 672 -1 036
Payment of principal portion of lease liabilities -141 -138
Dividend paid to equity holders of the parent company 5.8 -599 -547
Dividend paid to non-controlling interests -93 -79
Net cash flow from financing activities -220 -780
Net increase / decrease (-) in cash and cash equivalents 469 1 125
Net currency translation effect -37 -72
Cash and cash equivalents as of 1 January 4.2 2 956 1 903
Cash and cash equivalents as of 31 December 4.2 3 388 2 956
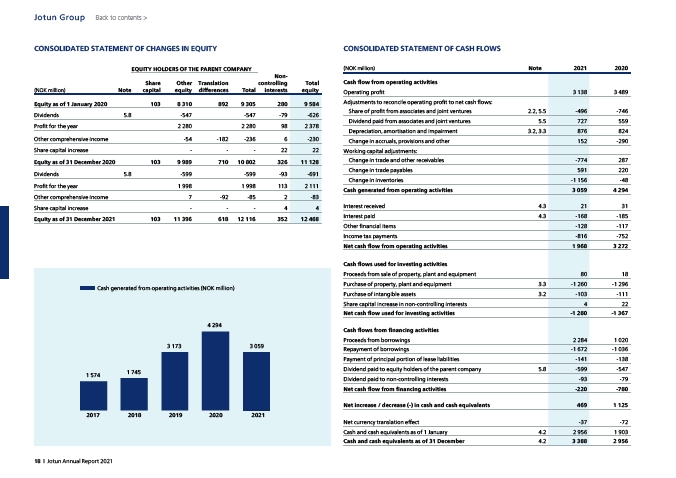
Cash generated from operating activities (NOK million)
2017
4 294
3 173 3 059
1 574 1 745
2018 2019 2020 2021
Jotun Group
18 I Jotun Annual Report 2021